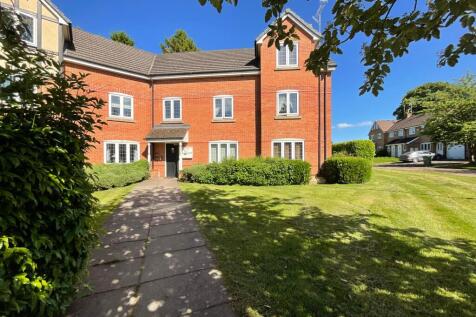
Lister Grove, Blythe Bridge, ST11
Apartment · 1 bed
Supports major UK property portals
Suggested Offer Range
Already 33.0% below the comparable sales mean — limited negotiation margin. Strong value at current asking price.


Property Details
- Asking Price
- £79,995
- Property Type
- Apartment
- Bedrooms
- 1
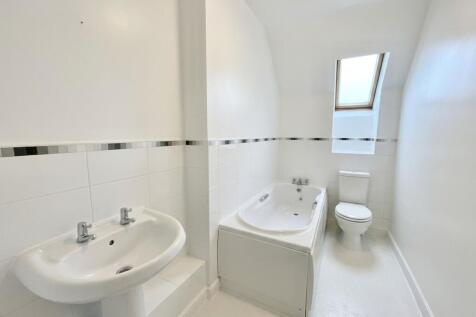
- Bathrooms
- N/A
- Est. Floor Area
- 577 sqft (est.)
- Article 4 Area
- ✓ No restriction — SA permitted under PD rights
This listing is priced below the postcode sector benchmark.
Motivated Seller Analysis
Standard — 2/10Behavioural signals: Below market value
💸 Mortgage & Financing
| Recommended LTV | 75.0% |
| Indicative Rate | 4.99% |
| Monthly IO Payment | £249 |
| ICR (actual) | 2.08x |
| Feasibility | PASS |
| 💲 Total Cash Required | |
| Purchase Price | £79,995 |
| Deposit (25% — 75% LTV) | £19,998 |
| SDLT (additional property, 5% surcharge) | £4,000 |
| Legal fees (est.) | £1,500 |
| Survey (est.) | £500 |
| Arrangement fee (est.) | £999 |
| Total cash required | £26,997 |
Legal and survey fees are estimates. SDLT applies 5% additional-property surcharge (Oct 2024 Budget). Not financial advice.
🔄 BRR Refinance Stress Test
| Purchase price | £79,995 | Loan (75% LTV) | £59,996 |
| Rate (IO) | 5.5% p.a. | Monthly interest | £275 |
| Rent needed (1.5×) | £412/mo | Estimated rent | £518/mo |
| Stress ratio | 1.88× (need ≥ 1.5×) +£106 surplus | ||
Assumptions: 75% LTV · 5.5% interest only · 1.5× rent coverage (standard lender requirement). Actual lender criteria vary — verify with your broker.
Exit Strategy
Capital appreciation projections at 2.5% pa (local Land Registry HPI). Assumes 75% LTV interest-only mortgage redeemed on sale. Excludes rental income.
| Est. reno cost | Unknown — score listing |
| Cash left in deal | Unknown |
| SA gross/mo | £1,304 |
| SA net/mo | £998 |
| BTL est./mo | £518 |
| SA vs BTL uplift | +£786/mo |
| Hold Period | Est. Sale Price | Capital Gain | Net Proceeds | Total Return |
|---|---|---|---|---|
| 3 years | £86,146 | +£6,151 | £22,601 | +£2,602 (3.3%) |
| 5 years | £90,507 | +£10,512 | £25,850 | +£5,852 (7.3%) |
| 7 years | £95,089 | +£15,094 | £29,264 | +£9,265 (11.6%) |
Projections: 2.5% pa HPI, 75% LTV IO mortgage redeemed at sale, 1.5% EA, £1,500 legal, 24% CGT above £3k allowance. Not financial advice.
Finance This Investment
Property SPV
Set up a limited company to hold property assets and reduce tax exposure.
Set up a property SPV from £12.99 — 1st FormationsEPC Certificates
Energy Performance Certificates, Gas Safety Checks and Electrical Condition Reports.
Get your EPCSell Your Property Fast
Cash purchases or auction. No fees. Ideal for motivated sellers or distressed assets.
Get a cash offerAffiliate disclosure: PropertyAlert.uk may earn a commission from these links at no extra cost to you.
Location
Comparable Sales in ST11 9
🔍 Filtered to 1-bedroom comparable sales only.
| Address | Type | Beds | Price | £/sqft | Date | Distance |
|---|---|---|---|---|---|---|
| 17, LISTER GROVE, ST11 9TS | Flat | 1 | £133,000 | £230 | 17/10/25 | < 0.1 mi |
| 41, LISTER GROVE, ST11 9TS | Flat | 1 | £115,000 | £194 | 10/10/25 | < 0.1 mi |
| 8, MILLBROOK GARDENS, ST11 9JQ | Flat | 1 | £110,000 | £213 | 28/02/25 | 1.25 mi |
■ Above subject ■ Below subject
Based on 3 comparable sales — Full Range (grey) · Typical IQR (blue) · Fair Value CI (light blue) · | Median · | Mean · Asking (▲)
ⓘ Bedroom counts are not available from Land Registry records. Comparables are matched by postcode sector and property type only.
📈 Rental Yield & ROI Forecast
Compound-growth projection: 2.5% annual rent growth + 3% capital growth. IO mortgage throughout. For illustration only.
| Year | Est. Rent/yr | Est. Value | Net Income/yr | Cum. Cashflow | Total Return | ROI on Cash Invested |
|---|---|---|---|---|---|---|
| Yr 1 | £6,216 | £82,395 | £4,030 | £1,030 | £3,430 | 12.2% |
| Yr 3 | £6,530 | £87,413 | £4,257 | £3,430 | £10,847 | 38.6% |
| Yr 5 | £6,861 | £92,736 | £4,495 | £6,299 | £19,040 | 67.8% |
| Yr 10 | £7,762 | £107,507 | £5,144 | £15,690 | £43,201 | 153.7% |
| Yr 15 | £8,782 | £124,630 | £5,878 | £28,577 | £73,212 | 260.6% |
| Yr 20 | £9,937 | £144,480 | £6,709 | £45,422 | £109,907 | 391.1% |
| Yr 25 | £11,242 | £167,492 | £7,649 | £66,744 | £154,241 | 548.9% |
| Yr 30 | £12,720 | £194,169 | £8,713 | £93,131 | £207,305 | 737.8% |
ROI on Total Cash Invested (deposit + SDLT + acquisition costs). Assumes IO mortgage, no tax, no refinancing. Actual returns will vary.
Planning Applications Nearby (within 0.5 miles)
🌎 Area Profile — ST11 9 ⓘ What are deciles?
📊 Investment Skill Analysis
Scenario Analysis
| Scenario | Monthly Rent | Gross Yield | Net Yield | Cashflow/mo | IRR 5yr |
|---|---|---|---|---|---|
| Bear | £440 | 6.6% | 3.7% | £-76 | -10.0% |
| Conservative | £482 | 7.2% | 4.5% | £25 | 0.7% |
| Base | £518 | 7.8% | 5.0% | £86 | 5.1% |
| Optimistic | £559 | 8.4% | 5.7% | £152 | 10.2% |
| Bull | £611 | 9.2% | 6.4% | £227 | 16.6% |
Detailed Analysis
💸 Yield & Returns
| Gross Yield | ●7.77% |
| Net Yield | ●5.04% |
| Net Annual Income | £4,031 |
| Deductions: void 8% (−£497) · mgmt 10% (−£622) · maint 10% (−£622) · fixed costs ins.+gas+EPC (−£445) | |
| Monthly IO Mortgage | £249 |
| Monthly Cashflow (IO) | ●£87 |
| Cash-on-Cash Return | ●3.67% |
| 5-Year IRR | ●5.1% |
● Above benchmark ● Near benchmark ● Below benchmark
💰 Tax Analysis
| SDLT (Additional Property) | £4,000 |
| SDLT Effective Rate | 5.0% |
| SDLT (Company) | £4,000 |
| Section 24 Extra Tax/yr (higher rate) | £600 |
| SPV Annual Saving | £1,131 |
| SPV Breakeven | — yrs |
| CGT Projected Sale (5yr) | £92,736 |
| Less: Purchase Price | −£79,995 |
| Less: Buying Costs (SDLT + legal) | −£6,600 |
| Less: Selling Costs (est. 2.5%) | −£2,318 |
| = CGT Net Gain (5yr) | £3,823 |
| CGT at 24% | £198 |
📈 Scenario Analysis
| Scenario | Monthly Rent | Gross Yield | Net Yield | Cashflow/mo | IRR 5yr |
|---|---|---|---|---|---|
| Bear | £440 | 6.6% | 3.7% | £-76 | -10.0% |
| Conservative | £482 | 7.2% | 4.5% | £25 | 0.7% |
| Base | £518 | 7.8% | 5.0% | £86 | 5.1% |
| Optimistic | £559 | 8.4% | 5.7% | £152 | 10.2% |
| Bull | £611 | 9.2% | 6.4% | £227 | 16.6% |